Accounts Payable Metrics: 8 KPIs, Formulas and Benchmarks
The 8 accounts payable metrics worth tracking, with formulas, worked numbers and dated benchmarks: cost per invoice, cycle time, exception rate, DPO and more.
Quick answer
The accounts payable metrics worth tracking are cost per invoice, invoice cycle time, exception rate, straight-through rate, days payable outstanding, early payment discount capture, duplicate payment rate and invoices per AP employee. Cost per invoice is total AP cost (people, systems, overhead and outside fees) divided by invoices processed in the same period. Ardent Partners puts the 2025 average at $9.84 per invoice and 8.2 days to process, against $2.65 and 2.9 days for best-in-class teams. Start with cost, cycle time and exception rate, then add the rest.
Why listen to us: ECIT Digital processes supplier invoices for finance teams every day. Our AI reads every invoice, our people check what the AI is unsure about, and we guarantee 99.8% accuracy on the data we deliver.
I own a smartwatch that tracks 23 things about me. It knows my steps, my heart rate and my sleep score, and last Tuesday it congratulated me for "standing" while I was standing in a queue for doughnuts [it was a long queue, I earned that badge].
Twenty-three numbers, and not one of them has made me healthier. AP dashboards have the same problem: lots of numbers, very few that change a decision. This guide covers the 8 accounts payable metrics that matter, with the formula for each, a worked calculation, dated benchmarks, and the ones you can quietly stop reporting [my watch will not be invited to that last section].
Measuring is step 6 of our accounts payable automation best practices.
The 8 accounts payable metrics at a glance
The whole guide on one screen, for the reader whose CFO wants a dashboard by Friday [it is Thursday, I can tell].
| Metric | Formula | What it tells you |
|---|---|---|
| Cost per invoice | Total AP cost / invoices processed | How efficient the whole process is |
| Invoice cycle time | Average days from receipt to approved for payment | Where invoices wait |
| Exception rate | Invoices needing manual handling / invoices received | How clean your data and POs are |
| Straight-through rate | Invoices processed with no human touch / invoices received | How much of the work is truly automated |
| Days payable outstanding | Average AP / cost of goods sold x days in period | How long you hold on to cash |
| Discount capture rate | Discounts taken / discounts offered | Money left on the table |
| Duplicate payment rate | Duplicate or wrong payments / total disbursements | Leakage and control strength |
| Invoices per AP employee | Invoices processed / AP full-time equivalents | Team capacity |
1. Cost per invoice: the cost of processing an invoice
Cost per invoice is the one number every CFO asks for, and the one most teams calculate wrong. The trick is counting everything, not just the clerk's salary [the clerk is not the only one touching that invoice, sadly].
APQC, the benchmarking research group, spells out what goes in: "The total cost to process accounts payable includes labor, systems, outsourcing, overhead, and other AP process costs."
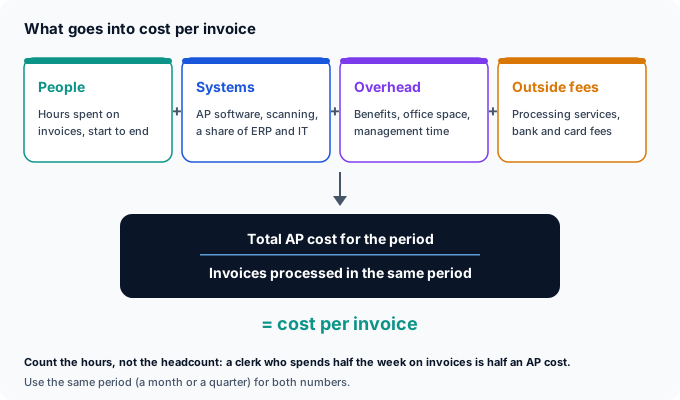
Here is a worked calculation for one month at a fictional company, so you can see the math with real-looking numbers.
| Cost bucket | What we counted | Monthly cost |
|---|---|---|
| People | Two clerks spending 60% of their time on invoices, at $6,000 a month each, fully loaded | $7,200 |
| Systems | AP tool subscription and a share of ERP licences | $1,500 |
| Overhead | A share of the controller's time and office costs | $800 |
| Outside fees | Scanning service and bank fees | $500 |
| Total | 1,250 invoices processed that month | $10,000 in total: $8.00 per invoice |
Fictional numbers, to show the method.
How does $8.00 compare? Ardent Partners' State of ePayables 2025 puts the average at $9.84 and best-in-class at $2.65. APQC's 2018 data from 1,485 organizations found "At the median are the organizations spending $5.83 to process an invoice", with the bottom quarter at $10 or more.
The two studies count costs differently, so compare yourself to one at a time [benchmarks are like smartwatch brands, they never agree on your sleep]. The bigger lesson sits in the People row: most of the cost is hours, and most of those hours go on reading, typing and fixing invoice data.
2. Invoice cycle time
Invoice cycle time is the average number of days from the moment an invoice arrives to the moment it is approved and ready to pay. It is the metric that tells you where invoices take naps.
Ardent Partners' 2025 benchmark puts the average at 8.2 days, against 2.9 days for best-in-class teams. Measure it from the date the invoice reached you, not the date printed on it, or a supplier who posts invoices late will make your team look slow [the post office is not on your payroll].
Then split the total by step: arrival to captured, captured to matched, matched to approved. One of those three is almost always the villain, and it is usually approval.

3. Exception rate
The exception rate is the share of invoices that cannot go through on their own and need a person: a price that does not match the PO, a missing receipt, no PO number, a possible duplicate. It is the best single measure of how clean your inputs are.
Ardent's Andrew Bartolini reports that "The invoice exception rate for AP departments is, on average, 18.4%." Best-in-class teams sit at 11.1% [I would like my smartwatch to have an exception rate, it currently has 23].
Track exceptions by reason, not just in total. "Price mismatch" points at purchasing, "no PO" points at budget owners, and "wrong data captured" points at whoever reads the invoices. Our guide to invoice matching covers tolerances, which decide how many small differences become exceptions in the first place.
4. Straight-through rate
The straight-through rate (also called the touchless rate) is the share of invoices that go from arrival to approved with no human touch at all. It is the mirror image of the exception rate, and the number AP automation projects are usually judged on.
In Ardent's 2025 data, the average team processed 35.4% of invoices straight-through and best-in-class teams 51.0%. The Hackett Group reports that "leading solutions achieve 60% touchless, straight-through processing".
Watch the denominator. A straight-through rate that only counts PO invoices from your ten cleanest suppliers will look fantastic and mean nothing [like my watch counting the doughnut queue as exercise]. Always divide by every invoice received.
5. Days payable outstanding (DPO)
Days payable outstanding is how long, on average, you take to pay your suppliers. The Corporate Finance Institute gives the standard formula: "Days Payable Outstanding = (Average Accounts Payable / Cost of Goods Sold) x Number of Days in Accounting Period".
| Input | Value |
|---|---|
| Average accounts payable for the year | $400,000 |
| Cost of goods sold for the year | $4.8 million |
| Days in the period | 365 |
| DPO | $400,000 / $4.8 million x 365 = about 30 days |
Fictional numbers, to show the method.
DPO is a treasury metric more than an AP efficiency metric. Higher is not automatically better: stretching suppliers past their terms costs goodwill, late fees and the discounts in the next section [your suppliers have smartwatches too, and they are tracking you].
6. Early payment discount capture
Some suppliers offer a discount for paying early, written as terms like "2/10 net 30": 2% off if you pay within 10 days, otherwise the full amount in 30. The capture rate is simply discounts taken divided by discounts offered.
Those discounts are worth more than they look. The OpenStax finance textbook works through 2/10 net 30 and concludes "The annual cost to NAI of not taking advantage of the discount for quick payment is 36.73 percent." That is the annualized return on paying 20 days early, which beats most things your treasury team can buy.
You can only capture a discount if the invoice is approved inside the window. So discount capture is really a cycle time metric wearing a nicer suit: an 8-day cycle leaves 2 days to pay on 2/10 terms, a 3-day cycle leaves 7 [the suit is also from a discount rack].
7. Duplicate payment rate
The duplicate payment rate is the value of duplicate or wrong payments as a share of everything you paid out. APQC data shows that even top performers report 0.8% of annual disbursements as duplicate or erroneous payments, against 2% for bottom performers.
| Annual supplier spend | At 0.8% (top performers) | At 2% (bottom performers) |
|---|---|---|
| $5 million | $40,000 | $100,000 |
| $20 million | $160,000 | $400,000 |
| $100 million | $800,000 | $2 million |
Most duplicates start at capture: the same PDF emailed twice, an invoice number keyed with a typo so the system does not spot the repeat, or one supplier set up under two names. Track how many your checks catch before payment as well as how many slip through, because the first number tells you the controls are working [unlike my watch, which has never once caught me eating a second doughnut].
8. Invoices per AP employee
Invoices per AP employee divides the invoices you process in a year by the full-time equivalents working on AP. APQC data reported by CFO.com shows 6,488 invoices per employee in the bottom quartile and 20,964 in the top quartile.
Count full-time equivalents, not people. Two clerks who each spend half their week on invoices are one FTE, and the controller who signs off payment runs is a slice of one. Get that wrong and the number moves every time someone changes job title, which is not the same as getting faster [I once renamed my morning walk "interval training", and my watch was not fooled].
AP metrics that mislead (and what to track instead)
Every dashboard has a few numbers that look busy and change nothing. Here are the usual suspects [my watch's "stand hours" would be on this list if it were an invoice].
| Misleading metric | Why it misleads | Track this instead |
|---|---|---|
| Number of invoices processed | Goes up when the business grows, not when AP improves | Cost per invoice and cycle time |
| Headcount in AP | Ignores the hours other people spend chasing approvals | Invoices per FTE, counting everyone's hours |
| Straight-through rate on PO invoices only | Leaves out the messy invoices where the work is | Straight-through rate on all invoices received |
| Average days to pay | Mixes early discounts, on-time and late payments into one number | On-time payment rate plus discount capture |
| Exceptions in total | Hides which team owns the fix | Exceptions by reason |
If a number cannot make someone change what they do on Monday, it belongs in an appendix, not on the dashboard.
How to start measuring with no AP software
You do not need a dashboard tool to get your first numbers. You need a spreadsheet, a month of data and about an afternoon [plus coffee, the spreadsheet does not run on its own].
Count last month's invoices
From the ERP or the AP inbox. This is the denominator for almost everything.
Ask everyone for their hours
Clerks, approvers and the controller: roughly how many hours a week go on invoices.
Add systems and fees
Subscriptions, scanning, bank fees and a fair share of the ERP.
Sample 50 invoices
Note the date each arrived, the date it was approved and whether anyone had to fix it.
Work out three numbers
Cost per invoice, average cycle time and exception rate. Repeat next month and compare.
Fifty invoices will not survive an audit, but they will tell you where the time goes, which is the point. Once you have a baseline, our guide to the accounts payable workflow shows how to map the steps behind the numbers.
What we see in the field
We sit at the capture step for a lot of AP teams, which means we see their metrics change from the inside [like a smartwatch, but one that actually does something].

- Most metrics are downstream of data quality. A misread total becomes an exception, a slower cycle, a missed discount and sometimes a duplicate. Fixing capture moves several numbers at once.
- Teams measure what their tools make easy. If the AP tool only reports clean PO invoices, the dashboard quietly ignores the hard ones.
- Clients never touch the document. Clean data lands in their ERP or AP workflow tool, and a person checks every field our AI is unsure about, which is how the 99.8% accuracy guarantee holds.
- The first baseline is the hardest. After one honest month of numbers, the second month takes minutes.
Want your own numbers without the spreadsheet? Run the free invoice health check: it scores your invoice process in about 3 minutes and estimates what you could save, based on your own numbers.
Move the numbers that matter
Clean invoice data in your ERP, 99.8% accuracy guaranteed
Our AI reads every invoice, our team checks what the AI is unsure about, and validated data goes straight into your ERP or AP tool. You pay per document, with no license.
As for my smartwatch: I turned off 20 of its 23 numbers. It now tracks steps, sleep and heart rate, and I actually look at all three [the doughnut badge has been retired with honours]. Three to five numbers you act on beat twenty-three you scroll past.
Sondre Bratlandsmo
November 10, 2026
Book free live demo
Learn how the ECIT Digital solutions can help you with the help from one of our experts.


Frequently asked questions
The most important accounts payable metrics are cost per invoice, invoice cycle time and exception rate, followed by straight-through rate, days payable outstanding, early payment discount capture, duplicate payment rate and invoices per AP employee. If you are starting from scratch, measure cost per invoice, cycle time and exception rate first, because they show where time and money go.
Add up the total cost of accounts payable for a period, then divide it by the number of invoices processed in the same period. Total cost should include labor (the hours everyone spends on invoices, not just AP staff), systems, outsourcing and processing fees, and overhead.
Ardent Partners' State of ePayables 2025 puts the average cost to process an invoice at $9.84 and best-in-class teams at $2.65. APQC's 2018 benchmark put the median at $5.83, with top performers at $2.07 or less. Benchmarks count costs differently, so compare yourself to one study at a time.
Ardent Partners reports an average invoice exception rate of 18.4%, and 11.1% for best-in-class teams. Track exceptions by reason, such as price mismatch, missing PO or wrong captured data, so each one goes to the team that can fix it.
Days payable outstanding (DPO) is average accounts payable divided by cost of goods sold, multiplied by the number of days in the period. A company with $400,000 in average payables and $4.8 million in annual cost of goods sold has a DPO of about 30 days.
Not always. A higher DPO keeps cash in the business longer, but paying suppliers after their terms can cost late fees, supplier goodwill and early payment discounts. Missing a 2/10 net 30 discount is equivalent to an annual cost of about 36.7%.
Relevant articles
Paperless Accounts Payable: How to Go Paperless, Even When Suppliers Do Not

Lease Abstraction: What Goes in a Lease Abstract, With a Sample